Introduction to Continuous Monitoring in DevOps


Continuous Monitoring in DevOps refers to the practice of continuously observing and analyzing the performance, security, and availability of software systems throughout their entire lifecycle, from development to production. It involves the use of various tools and techniques to collect data, detect issues, and ensure that the system is running smoothly.
Similarly, in DevOps, continuous monitoring involves using tools like application performance monitoring (APM) systems, log analyzers, and security scanners to keep an eye on the health and performance of software applications. For instance, if an APM tool detects a sudden increase in response time or a spike in error rates in a web application, it alerts the DevOps team so they can investigate and fix the issue before it impacts users. monitoring is crucial in DevOps because it helps teams identify and address issues quickly, leading to improved system reliability, faster problem resolution, and better overall user experience.

Real-time Monitoring: Real-time monitoring involves continuously tracking and analyzing data as it occurs, providing immediate insights into the current state of a system or application. Example Tool: Prometheus is a real-time monitoring tool commonly used in DevOps. It collects metrics from configured targets at specified intervals, allowing you to visualize and alert on real-time data related to system and application performance.
Infrastructure Monitoring: Infrastructure monitoring focuses on monitoring the hardware, network devices, and other components of an IT infrastructure to ensure they're functioning properly. Example Tool: Nagios is a widely used infrastructure monitoring tool. It allows you to monitor servers, switches, routers, and other network devices, providing alerts when issues arise such as high CPU usage or low disk space.
Application Monitoring: Application monitoring involves tracking the performance and behavior of software applications to ensure they meet performance and availability requirements. Example Tool: New Relic is a popular application monitoring tool. It provides insights into application performance by monitoring transactions, tracing code execution, and identifying performance bottlenecks, helping developers optimize their applications for better performance.
Network Monitoring: Network monitoring focuses on monitoring network traffic and devices to identify and troubleshoot issues such as network congestion, packet loss, or security threats. Example Tool: Wireshark is a widely used network monitoring tool. It captures and analyzes network packets in real-time, allowing you to inspect network traffic, troubleshoot network issues, and detect security vulnerabilities.
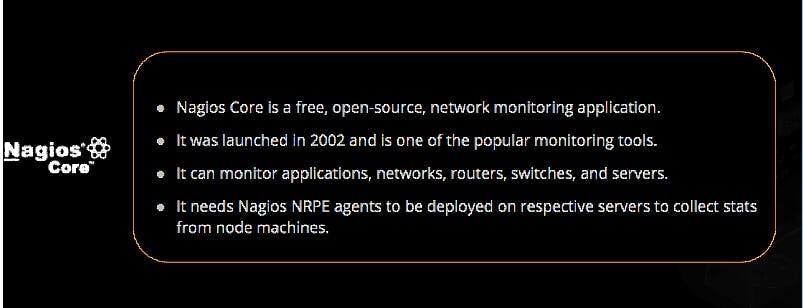
For instance, if one of your servers starts to get overloaded with too much traffic, Nagios Core will alert you so you can take action before it crashes. Or if a switch suddenly goes offline, Nagios Core will let you know so you can troubleshoot and fix the problem.

You install Zabbix on these servers. Now, whenever there's a problem – like if one of the servers crashes or if the website starts responding slowly – Zabbix sends you an alert. You can then log in to Zabbix to see what's going on and take steps to fix the issue before it affects your customers.
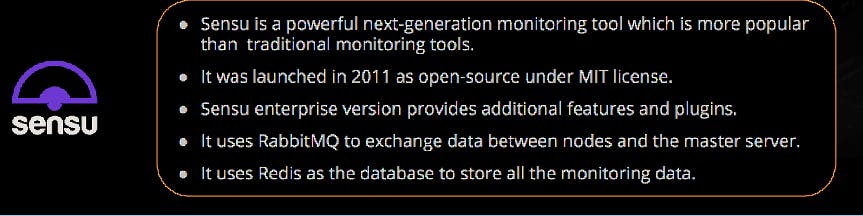
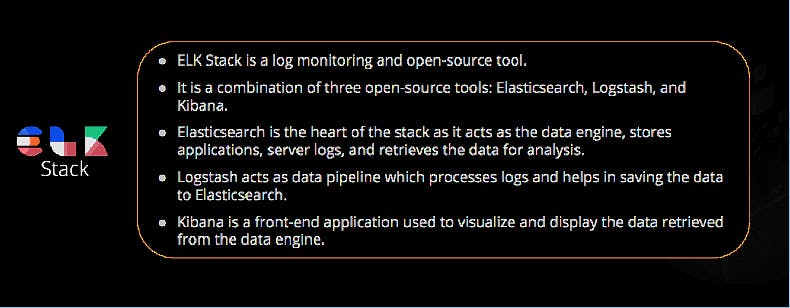
Sensu monitors various aspects of your IT infrastructure, including servers, applications, and network devices. it used to monitor Server Health( cpu , memory ) Application Performance(response times, throughput, and error rates).Network Connectivity(connectivity issues, packet loss, and latency between different network devices),Custom Metrics (write a check to monitor the number of active users on a website or the latency of database queries)

Application Performance Monitoring (APM) New Relic is renowned for its APM capabilities, which involve monitoring the performance of web applications, mobile apps, and microservices
Infrastructure Monitoring: New Relic also offers infrastructure monitoring features to track the health and performance of servers, virtual machines, containers, and cloud services. Real User Monitoring (RUM): With New Relic's RUM capabilities, businesses can gain visibility into how real users are interacting with their web applications.

Splunk is like a detective for your data. Here's a simple breakdown:
Data Collection: Splunk gathers data from different sources like logs, metrics, and events. It collects this data from your systems, applications, and devices, essentially bringing all your data into one place.
Search and Analysis: Just like how a detective sifts through evidence to find clues, Splunk allows you to search and analyze your data to uncover insights. You can search for specific keywords, filter results, and visualize data to understand what's happening across your systems.
Alerts and Monitoring: Splunk can also monitor your data in real-time. It can detect anomalies, patterns, or specific events and send you alerts when it finds something noteworthy. This helps you stay on top of issues and take action before they become bigger problems.
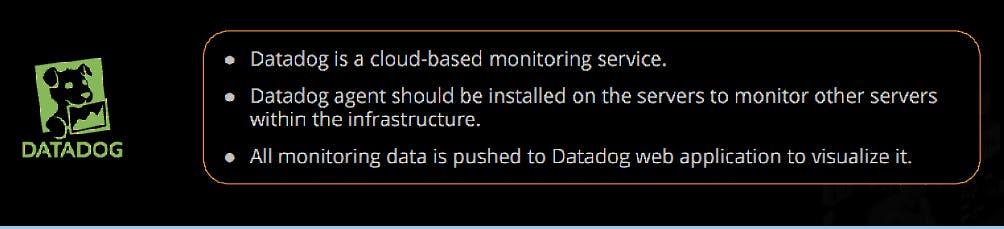
Datadog is a cloud-based monitoring service that helps businesses monitor the health and performance of their IT infrastructure and applications. In simple terms, it's like having a virtual watchdog that keeps an eye on your systems and alerts you if anything goes wrong.
Cloud-Based: Datadog operates in the cloud, which means you don't need to set up any on-premises infrastructure to use it. You can access Datadog's monitoring capabilities through a web browser, making it easy to get started and manage from anywhere.
Monitoring Service: Datadog provides a suite of monitoring tools. Alerting and Reporting: Datadog offers alerting capabilities to notify you when it detects issues with your systems